Workday vs. Salesforce's Efficiency and The Cost of Churn
Welcome to Tidal Wave, an investment and research newsletter about software, internet, and media businesses. Please subscribe so I can meet Matt Levine one day.
Given this is an investment-focused post, a quick disclaimer: this is not investment advice, and the author holds positions in the securities discussed.
One of the follow-ups to my recent post on Workday (from Portsea and DMs) was to the tune of: “Why has Salesforce not seen similar levels of operating efficiency as Workday?” Salesforce’s S&M as a % of Revenues is ~39% vs. ~25% for Workday. It’s a fair and pertinent question.
Beyond the simple (not simplistic) “Salesforce wastes,” there are two potential reasons for this:
Salesforce’s growth has not decelerated to the same extent as Workday’s.
Workday’s growth is more efficient than Salesforce’s1.
For both points, there’s a “management” component and a “structural” component. The management components are the near-term investment choices made by the company. The structural components are a function of the end market and products, which are, of course, a reflection of choices made by management years ago.
There’s definitely a “waste” component to this as well, but from the outside in, that’s obviously hard to analyze.
Salesforce’s Growth Persistence
From a financial model perspective, companies that are consistently growing Net New ARR cannot show meaningful operating margin improvements. Salesforce has been beating this drum for a while and has gone to great lengths to explain that to investors.
“But what's the growth philosophy of this business [Trailblazer]? The growth philosophy is, we are going to sustain growth, and we are going to grow that incremental amount by 20% per year…There is no structural leverage in this company because the revenue growth is the same as the new business growth. It's not to say this company can't generate leverage. It's to say there's no structural model leverage in this company.”2
And if you were to model this out on a spreadsheet, this largely checks out.
Given Salesforce’s view of the market size and opportunity, management has elected to take the “Trailblazer” approach. The company historically set a goal of growing 20%+ organically, which meant there was not much structural S&M margin expansion over the last ~5 years.
In contrast, Workday’s growth curve has been more traditional, and during the same period, the company’s growth has decelerated.
Per Salesforce’s view of the world, Workday probably falls in the Explorer camp, and Salesforce falls somewhere in between the Explorer and Trailblazer categories. Still, given the scale of the company and the portfolio of products at the company’s disposal, it is still a bit of a head-scratcher as to why Salesforce has not been able to drive down Cost to Book (CTB), which is defined as S&M/Incremental ARR.
The company offers a few explanations, namely that the shift in the business towards more international bookings hides some of the improvements in the core business. And that’s likely true. But also, given how at length Salesforce’s management has historically talked about the fact they’re unlikely to show meaningful sales and marketing leverage while the company is growing 20%+, it’s unlikely there was even a mandate internally to improve CTB meaningfully.
The net result is that Workday has been able to show slightly more S&M margin improvements than Salesforce. But not by that much! During this period, Salesforce’s S&M as a % of revenues decreased by ~10 percentage points vs. ~11 percentage points by Workday.
So how does Workday have that much lower S&M burden than Salesforce? The main reason boils down to the differences in churn rates.
The Cost of Gross Retention
Workday’s revenue retention is ~98% vs. ~93% for Core Salesforce (~90% for Core Salesforce plus Tableau, Mulesoft, and Slack)3. That difference in revenue churn can be very costly, especially when the company, like Salesforce, has specific growth targets.
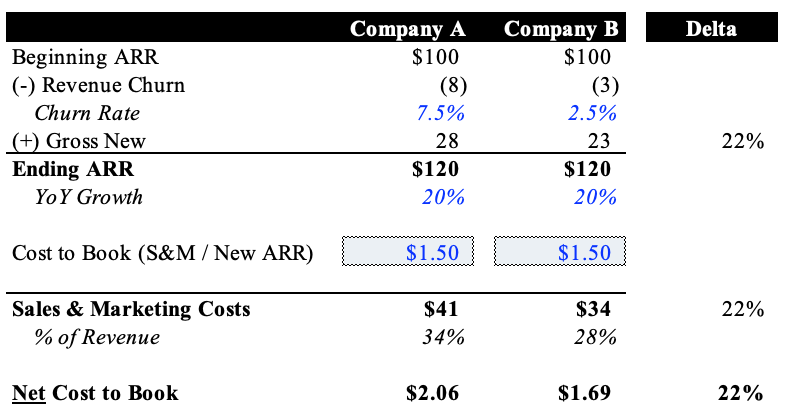
Take this simple ceteris paribus example to illustrate.
In this example, Company A and Company B are both trying to grow 20% YoY. Because of the differences in churn, Company A, which in this case is representative of Salesforce, needs to add 22% more Gross New ARR to meet that goal than Company B. Assuming the same “Cost to Book” for both companies, the S&M for Company A will also be 22% higher. And the Net Cost to Book (or Blended CAC as most public investors calculate it) is also 22% higher for Company A.
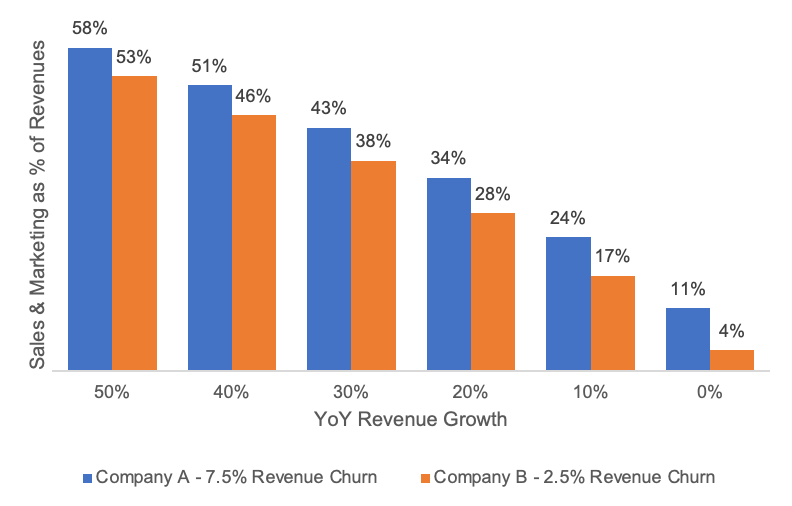
You can further extend this analysis by looking at the S&M costs of these two companies at different growth rates.
The implication is that the company with a lower churn rate will structurally have higher long-term margins, and ergo, the value of their revenue stream and installed base is higher. The interesting thing about this analysis is that the gap between the two company’s S&M costs slightly increases as the growth rate decreases.
So even though Salesforce’s sales and marketing spend will begin to show leverage as growth decelerates unless the company can (1) improve CTB and/or (2) lower attrition, Workday will always have a lower S&M burden compared to Salesforce.
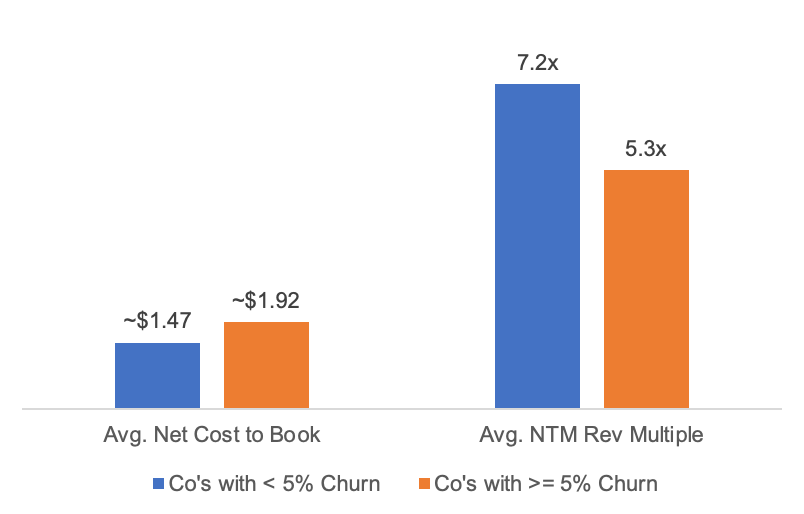
This dynamic is consistent across a broader sample of SaaS companies. The chart below compares two sets of public companies: ones with revenue churn of less than 5% and ones with churn greater than or equal to 5%45.
Companies with less than 5% churn have an ARR CAC / Net Cost to Book that is, on average, 30% more than their higher churn counterparts. Additionally, these companies, on average, have a higher revenue multiple. This intuitively makes sense. Companies with lower churn will have structurally higher margins at steady state growth (~10%), and as a result, their revenue streams are more valuable67.
In effect, both the Cost to Book and NTM Rev Multiple are functions of a company’s gross churn, which in turn is a function of the company’s product and customer segment.
All this leads back to the classic aphorism in tech, retention is the key to growth. And in an increasingly constraint-oriented market environment, retention is the key to efficient and durable growth. In 2023 and (maybe 2024 as well), the most rational thing for a SaaS company (both public and private) is to focus most of their energy and efforts on how to increase gross retention above new sales. There are three reasons for this:
A weak demand environment likely means sales cycles will be long and conversion will be low → CACs will be higher.
Investors will be more forgiving about weak sales in ‘23
It sets the company up to re-accelerate growth on a healthier base once the buying environment improves.
Said another way, the LTV/CAC of customers acquired in 2023 will be crappy, so it’s better to invest in increasing the LTV of existing customers and future customers. Like all commentary from investors, this is easier said than done. If it were easy for a company to reduce churn, they would have likely found it and done it.
But for the few companies that may have levers to pull beyond contracting — this might be an opportune year to focus product investments on that (I know Benioff said he wished he’d invested more in the GFC).
Salesforce Gross Retention Opportunity
In my first post about Salesforce’s near-term opportunities, I highlighted churn reduction is likely going to be one of the major drivers for the business moving forward:
At this stage of the company’s lifecycle, the reduction in churn associated with the increase in multi-cloud adoption is going to be very impactful. Today, Salesforce has ~93% gross revenue retention, which is good but not exactly best-in-class, especially for a tool that’s often considered to be mission-critical for companies.
And the company has done that pretty well over the last few years…
…in part due to the company’s ability to drive continued multi-cloud expansion.
However, the lack of improvements in CTB for Salesforce probably lies somewhere here. My hypothesis is that to reduce churn, Salesforce has been acquiring and pushing GTM teams to drive multi-cloud expansion. To help drive multi-cloud adoption, reps have been giving customers meaningful/steep discounts to become “multi-cloud.” In effect, the benefits of cross-selling are being captured by the customers in the form of price.
This was probably the right strategy, in some instances, Marketing Cloud. And probably the wrong in other instances, Tableau. Given recent comments around Genie / Data Cloud, we probably will see similar behavior there as well.
The other implication of Salesforce’s go-forward focus on churn reduction is that the company will increasingly encroach into product areas that the company has historically allowed 3rd party vendors to own. Two reasons for this:
(1) Salesforce can find shorter-cycle “non-cloud” products to increase retention
(2) Microsoft’s bet around Dynamics, Viva, Teams, and the Knowledge Graph is pushing the Microsoft ecosystem into a direction where no one outside of the Salesforce administrator has to ever actually interact with Salesforce. This is obviously not a good thing for Salesforce, so the most natural decision/strategy is for Salesforce to increase the surface area of its UI and engagement.
And given the Zeitgeist, the most natural outcome is for Salesforce to launch more LLM-driven products around their existing product suite for sales reps and marketers.
If you’re finding this newsletter interesting, share it with a friend, and consider subscribing if you haven’t already.
Always feel free to drop me a line at ardacapital01@gmail.com if there’s anything you’d like to share or have questions about. Again, this is not investment advice, so do your own due diligence.
There’s a third option as well; the company is just managed poorly. This might be partially true but cannot be the only explanation given the company’s objectively remarkable success.
This is actually surprising to a lot of people.
Companies in the “< 5% Churn” group include Blackline, Clearwater, Crowdstrike, Jfrog, SentinelOne, Workday, Workiva
Companies in the “>= 5% Churn” group include Coupa, Domo, Hubspot, Okta, PowerSchool, Salesforce, Smartsheet, Weave
Of course, the caveat to this analysis is that there are meaningful sample limitations. Only a few companies disclose their revenue churn.
There are, of course, exceptions to this mental model, such as Hubspot. Hubspot has 10-12% gross retention, but their GTM engine is very efficient (~$1.60 CTB). The efficiency is driven in large part by the company’s strong organic inbound funnel and high conversion ratios.


Great article as usual.
"Workday’s revenue retention is ~98% vs. ~93% for Core Salesforce (~90% for Core Salesforce plus Tableau, Mulesoft, and Slack)" -- where are you getting that data from, verbally on earnings calls? Or do they report these numbers as part of their quarterly reporting packet?
Thanks for sharing! This is a fantastic post. One Q- "In this example, Company A and Company B are both trying to grow 20% YoY. Because of the differences in churn, Company A, which in this case is representative of Salesforce, needs to add 22% more Net New ARR to meet that goal than Company B. Assuming the same “Cost to Book” for both companies, the S&M for Company A will also be 22% higher." Do you mean gross new ARR in this example/chart? Company A has to add $28M of gross ARR vs $23M for Company B - those are gross figures.